Model 20/20 PSD GUI
Data Display:
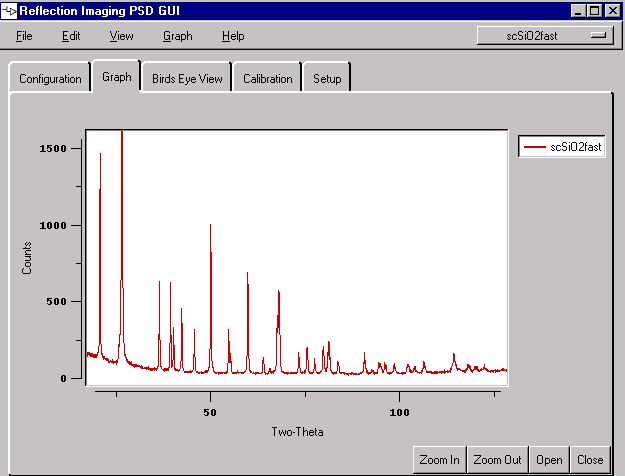
* Displays data array in graph. Horizontal axis is channel number (position); vertical is number of X-ray events counted (counts). Displays filename of current data.
* Y-axis of display auto scales to maximum number of counts in data array. X-axis auto scales to number of elements in data array.
* Arrow keys and mouse move cursor horizontally across data display; with indication of number of counts and channel number of cursor position in data array. A single push of the arrow key moves to the next data array element.
* Provides pan and zoom in data display x-axis, with autoscaling of y-axis.
* Displays bird's eye view plot of entire data set.
* Provides convenient means to name files, and "Save" button to save configuration and data to a file.
* Provides for display of old data files.
* Overlays old data set over new for comparison.
© 2002 Reflection Imaging, Inc.